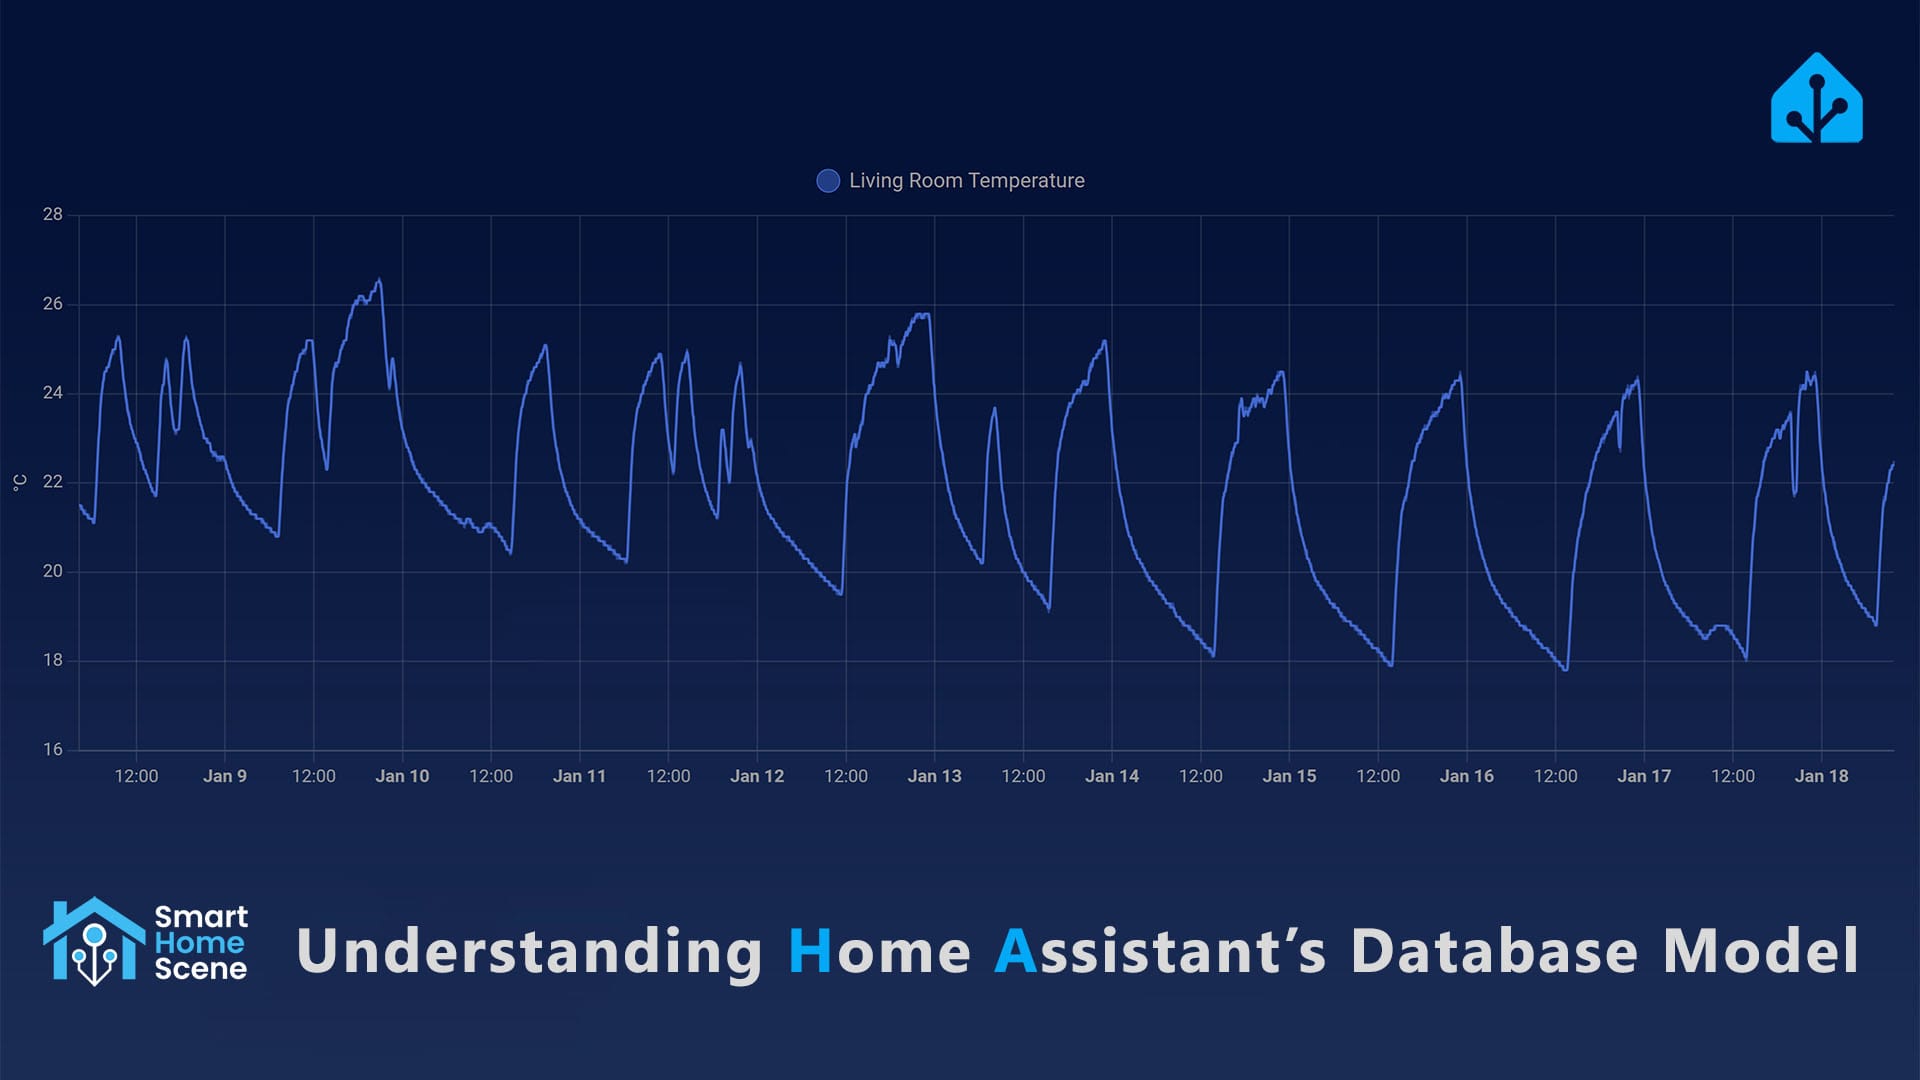
In the realm of Home Assistant, data is king. Understanding how your smart devices behave over time can unlock insights that lead to more efficient smart home management. Automating based on your device history can be key to saving significant amount of energy and optimizing device usage.
In an article from 2022, I wrote how to optimize your Home Assistant database and filter your entities from the recorder. That article included guides for deploying MariaDB and InfluxDB, one replacing the default SQL database while the other used as an add-on for long-term data retention.
Since the release of the article, there have been many changes to the Home Assistant database system. Now, Home Assistant captures and records raw data for each entity, which is then aggregated as short-term statistics and long-term statistics.
This article explains the difference between both and ultimately answers the question:
Do you need a separate database system for retaining long-term statistics in 2025?
Introduction to Home Assistant Statistics
Before exploring the Home Assistant database model, it’s worth differentiating between short and long-term Home Assistant statistics. These are two types of data saving rules, derived from the raw data for each Home Assistant entity included in the recorder.
Short-term statistics capture snapshots of your smart home devices at regular intervals, typically every 5 minutes. These snapshots record various aspects of supported entities, including their states and aggregated values, to provide real-time insights into device behavior and assist in immediate decision-making.
Long-term statistics aggregate data from short-term statistics into hourly summaries, enabling a deeper analysis of trends and patterns over extended periods. With only 24 entries created per day, they minimize database storage requirements while preserving valuable historical data.
How Data is Stored in The Database
Home Assistant employs a structured database system to manage raw data, and aggregate short and long-term statistics. By dividing these statistics into different tables, Home Assistant can balance real-time insights with historical trend analysis. To visualize how data “moves” through Home Assistant’s database, I created a simple diagram:
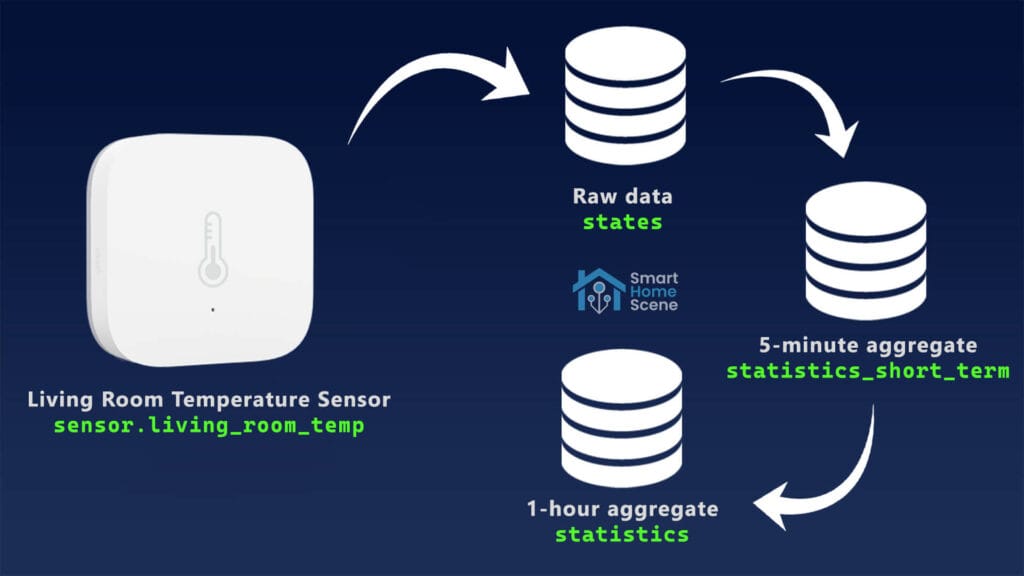
Raw data table – states
The states table stores objects events exactly as they happen, including the entity’s state and attributes.
Example:
sensor.living_room recorded at 12:02:47 PM, had mean 22.5°C, min 22.3°C, max 23.8°C.
Short-term data table – statistics_short_term
The statistics_short_term table contains 5-minute aggregates of data pulled from the states table. It captures metrics such as the mean, min, max, and sum of supported entities, providing detailed snapshots of real-time activity.
Example:
sensor.living_room recorded at 12:05 PM, had mean 22.3°C, min 22.2°C, max 23.9°C.
Long-term data table – statistics
The statistics table stores hourly aggregates derived from the statistics_short_term table. These long-term statistics retain similar metrics but over extended periods, enabling users to analyze historical trends without significant database overhead.
Example:
sensor.living_room recorded at 13:00 PM, had mean 22.6°C, min 22.1°C, max 23.8°C.
Metadata table – statistics_meta
The statistics_meta table serves as a central reference, storing metadata about the data source for both short-term and long-term statistics. This includes the entity ID, source type, and unit of measurement. For entities, the statistic_id in this table corresponds to the entity_id.
Example:
sensor.living_room has unit_of_measurement °C, state_class measurement, device_class temperature, supports mean, min, and max readings.
How Data is Used on the Front-end
Home Assistant’s front-end provides an intuitive and customizable interface that uses stored data to offer insights and control over your smart home. Data from the database, including raw states, short-term statistics, and long-term statistics, powers various front-end features to ensure seamless monitoring and analysis. Here’s how this data is utilized:
History Panel
The History Panel offers a timeline view of your entities’ past states and changes, allowing users to explore historical data interactively. The History panel uses data in the following manner:
- Raw data from
statestable: Displays precise, timestamped raw state changes and attribute updates for entities during the recorder’s retention period (default 10 days). - Long-term data from
statisticstable: When the selected time frame exceeds the recorder’s retention period, it uses hourly averages from long-term statistics.
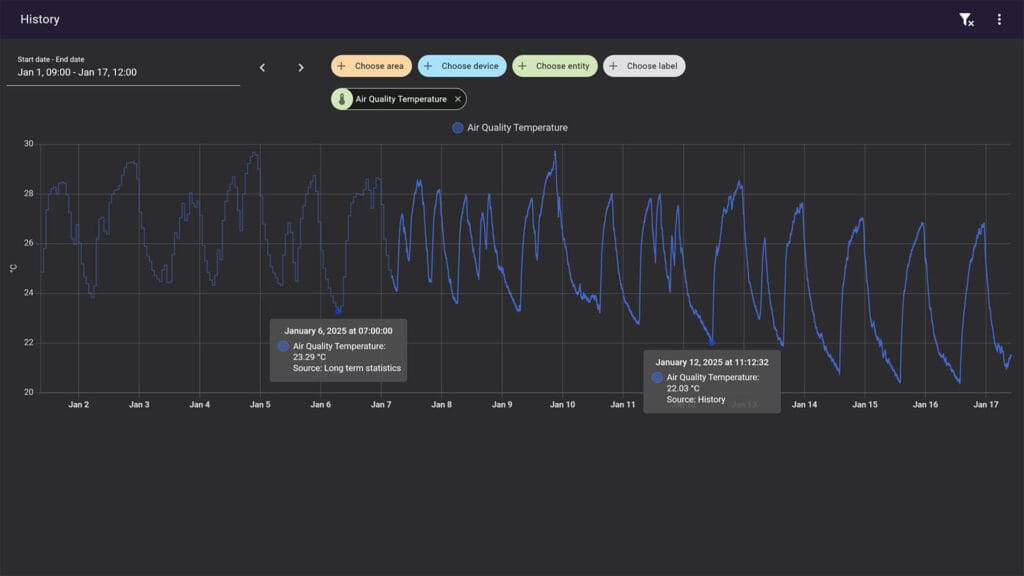
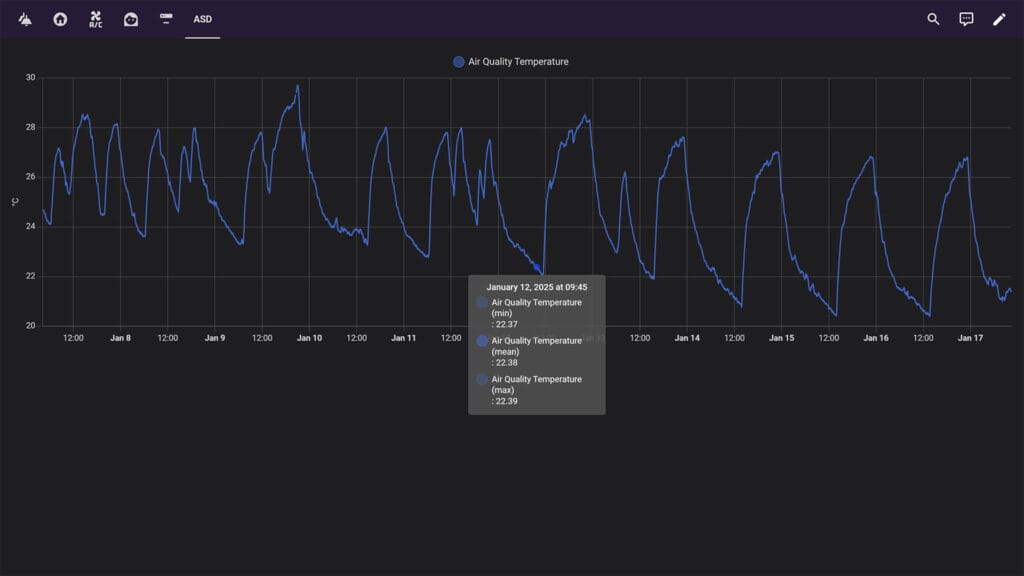
See this image from my own Home Assistant instance. With the default retention period of 10 days, raw data is kept in the states table only for those 10 days. However, hourly data is aggregated indefinitely and shown in the History panel integration at 1 hour intervals. Hovering over any data point tells you the source of the data, also differentiated by the thickness of the graph line.
Logbook Panel
The Logbook panel provides a chronological overview of events and state changes within Home Assistant. It relies solely on the states table to retrieve information about entity state changes and events, offering a narrative of activities in the system. Unlike the history panel, the logbook panel does not provide aggregated data beyond the recorder retention period (default: 10 days).

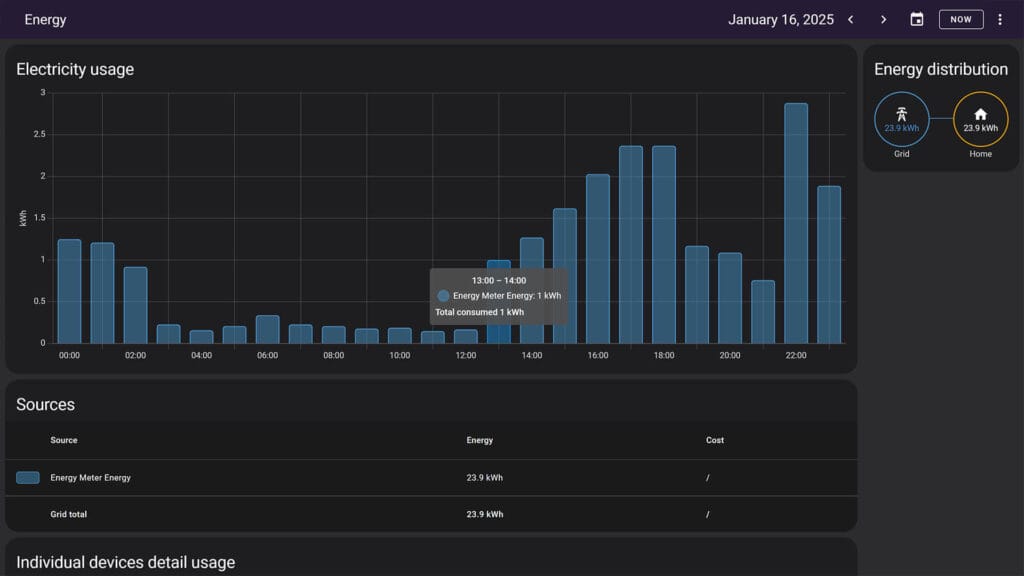
Energy Panel
The Energy panel offers insights into energy consumption and production over time. It leverages the statistics table, which stores hourly aggregated data, to display long-term trends and summaries of energy usage. The energy dashboard relies on sensor entities configured for energy monitoring (e.g., with state_class: total_increasing or total).
Dashboards
Dashboards in Home Assistant can be customized to display various types of data, including real-time and historical information. For example, the default Statistics Graph Card can use both statistics_short_term (5 minutes) and statistics (1 hour) table to present aggregated data. The period displayed depends on the selected range and the retention period set by the recorder. Some custom cards can display raw data from the states table, such the ApexCharts or MiniGraph card.
Filtering Entities from the Database
No matter whether you choose to use the default database or switch to MariaDB as a drop-in replacement, it’s crucial to filter your entities from the recorder. The recorder is the component (integration) necessary for saving data to the database and is a dependency for the history integration.
In a default Home Assistant setup, the recorder saves raw data for 10 days and has a commit interval of 5 seconds. Meaning, every 5 seconds data is saved to the database. No entities are excluded and everything is recorded as it happens. Now, this is why you need to filter entities from the recorder. There is absolutely no reason to keep a history of the battery life of the bedroom temperature sensor. This is where includes and excludes come into play.
Here a few examples, using includes, excludes and both for filtering entities, globs and domains from the recorder. Add this to you configuration.yaml file and edit accordingly:
Example 1: Using the default database, only include rules while excluding everything else, with a 20 days retention period and a 10 seconds commit interval:
Click to expand
recorder:
  purge_keep_days: 20
  commit_interval: 10
  include:
    domains:
      - light #Include all entities from light domain
    entity_globs:
      - sensor.weather_* #Include all entities from weather glob
    entities:
      - sensor.disk_free #Include individual entities
      - sensor.disk_use
      - sensor.disk_use_percent
Example 2: Using the default database, only exclude rules while including everything else, with a 15 days retention period and a 10 seconds commit interval:
Click to expand
recorder:
  purge_keep_days: 15
  commit_interval: 10
  exclude:
    domains:
      - automation #Exclude all entities from automation domain
    entity_globs:
      - binary_sensor.*_occupancy #Exclude all entities from occupancy glob
    entities:
      - switch.living_room_light #Exclude individual entities
      - light.bathroom_light
      - sensor.processor_temperature
Example 3: Using the default database, a combination of include and exclude rules, with a 30 days retention period and a 20 seconds commit interval:
Click to expand
recorder:
  purge_keep_days: 30
  commit_interval: 20
  include:
    domains:
      - light #Include all entities from light domain
    entity_globs:
      - sensor.weather_* #Include all entities from weather glob
  exclude:
    entities:
      - light.living_room_light #Exclude individual entities
You can edit these settings to match your own entities. My personal preference is to use only includes, as it’s easier to list all the things I need recorded as opposed to excluding all the things I don’t need recorded. It’s also worth noting that while not listed in my examples, the recorded uses the following settings by default as well:
db_url(Optional)
The URL that points to your database. Examples of these can be found here.db_max_retries(Optional, default: 10)
The max amount of times, the recorder retries to connect to the database.db_retry_wait(Optional, default: 3)
The time in seconds, that the recorder sleeps when trying to connect to the database.auto_purge(Optional, default: true)
Automatically purge the database every night at 04:12 local time. Purging keeps the database from growing indefinitely, which takes up disk space and can make Home Assistant slow. If you disableauto_purgeit is recommended that you create an automation to call therecorder.purgeperiodically.auto_repack(Optional, default: true)
Automatically repack the database every second sunday after the auto purge. Without a repack, the database may not decrease in size even after purging, which takes up disk space and can make Home Assistant slow. If you disableauto_repackit is recommended that you create an automation to call therecorder.purgeperiodically. This flag has no effect ifauto_purgeis disabled.
Using an External Database
When I wrote about optimizing your database and filtering you entities in 2022, I highly suggested you replace the default Home Assistant SQLite database with MariaDB. This was because MariaDB was/is superior in handling large datasets, has an easier extraction data system and boosted the overall performance of Home Assistant at the time.
But, should you replace the existing database now?
From a performance perspective: no.
With long-term statistics as a structure of Home Assistant’s database, the system no longer suffers from performance drops, lag and delays. Going beyond the default states retention period of 10 days may result in slower queries, but I see no reason to do so for a default setup. I mean, do you really need to know what the temperature was at 15:47:25s, 2 months ago? Probably not. If you do need to, you better have more powerful hardware when changing the retention period or consider using MariaDB as a drop-in replacement.
From a visualization and analysis perspective: maybe
If you intend on visualizing data with more advanced tools such as Grafana, it might be wise to setup an replacement database backup system. While Grafana can work with SQLite, it’s not natively supported as a data source and requires third-party plugins. Because of this, using MariaDB or InfluxDB can be considered a requirement. This can be done in many ways, including running MariaDB and InfluxDB in parallel as add-ons directly in Home Assistant. Even if you do not intend on using analytics tools like Grafana, InfluxDB has its own visualization and analytics interface which is much more advanced then what is available in Home Assistant by default.
From a safe-keeping and future-proofing perspective: yes
As your Home Assistant setup expands (e.g., adding more entities, automations, or integrations), database demands will increase. While SQLite can handle small to medium setups, MariaDB or similar databases are better equipped to handle large datasets and high write volumes without significant performance degradation. However, the most important point here is that MariaDB and InfluxDB can be set to run off-site. This allows for greater flexibility and creating a redundant data-keeping system, independent from Home Assistant.
There are many ways to achieve this, one of which is running both as LXCs on Proxmox:
MariaDB on Proxmox for Home Assistant
InfluxDB on Proxmox for Home Assistant
Final Thoughts
The introduction of structured short-term and long-term statistics in Home Assistant has significantly improved how data is captured and stored. Short-term statistics provide real-time insights by aggregating data every five minutes, while long-term statistics create hourly summaries for historical trend analysis. These advancements reduce database load and make the system more efficient, even with the default SQLite database.
For advanced visualization or future-proofing, replacing SQLite with MariaDB or InfluxDB may still be beneficial. These databases offer superior performance for larger setups, better integration with tools like Grafana, and options for off-site backups to safeguard your data. Ultimately, whether you stick with the default database or upgrade depends on your need for analytics, system scalability, and data redundancy.
In my main Home Assistant setup, I run both MariaDB and InfluxDB as Proxmox containers and record data with custom including/excluding rules. In a dev environment for testing devices, fully loaded to the brim, I run the default database and have not encountered any issues whatsoever. Whatever you decide, it’s absolutely crucial you take the time and filter entities from the recorder!


Thanks a lot for another great article!
You’re welcome!
Thanks for this follow up!
I followed your 2022 article and have Maria db running as an add on.
I nearly never look at long term and don’t use grafana etc.
Would you recommend switching back to the native database for simplicity of setup?
How?
Thank you!
If you are after simplicity and no-maintenance, yes, it might we worth switching back. If you are looking for a performance boost either way, there’s no need. MariaDB is still superior, it’s just that there is much less reason to use it now that long-term statistics are a thing
Thanks! How do I switch back? Just delete the Maria DB path in configuration?
Remove the recorder from configuration.yaml and remove the MariaDB add-on>
Note that your database will purge
Thank you Sir for another excellent Guide! While nothing really new for me personally, it is an awesome comprehensive Overview, well described, and let’s me think about ditching the InfluxDB (even once it saved my a**, though 🤪)
You’re welcome! I would say leave it if you have important data 🙂
Great article, very much detailed.
What are considered “small”, “Medium”, “large” setups? Number of entities?
The number of entities plays a role, yes.
But the recorder configuration is much more inmportant. If you have a long retention period, with frequent commit interval, it would produce a large dataset even with a low number of entities. That’s why it is important to filter and optimize.
Something weird is going on. My HA records ro a mariadb db on another rpi. I configured a new temp sensor and it recorded a bogus temp of 85C. Now my history graphs and dashboard were all off to accomodate for the very high value. I went into the db, saw the value in the ‘states’ table and updated it to the prior value (update because delete is troublesome with constraints on the prior entry and all). DB shows the corrected value, but HA still has the value in its graphs, even after a restart. Is there a cache somewhere ? How can I clear/correct that ? Thanks, Peter, Belgium
to continue on my own question : did I forget to commit ? Really weird somehow the old value appeared again in the DB (is HA re-parsing old entries?). Anyway I updated that 1 entry again, checked the state values again, and now the history graphs are working just fine. Sorry for the false alert.
— to fetch the metadat id :
SELECT * FROM hassio.states_meta sm where entity_id=”sensor.tempxyz”;
— to check the values rcvd and fetch the state_id of the erroneous entry :
SELECT state_id, state, attributes_id, metadata_id FROM hassio.states where metadata_id = 2195 order by state_id limit 100;
— to update the erroroneous entry :
update hassio.states set state = 16.75 where metadata_id = 2195 and state_id = 17993535;
— just to be sure :
commit;
Thx for this article! I was confused by HA own documentation. Now it is clear
Maybe a link from your old article to the new one should be added at the top of the old one?
Great suggestions, thanks! I’ve linked it!
Many thanks. Awesome article. One critical question though: I see 80% of my Database (8GB) is long term statistics. Of those there are only a handful of entities I’d like to keep. IS there a way to get rid of the ones I don’t want as their STATE CLASS is part of one of the three (Total increasing, Total, …). As the STATE CLASS cannot be changed I’m going in circles. I already excluded a lot from the recorder but this is handling only part of the remaining 20%. I’d like to tackle the 80%. So if I were to exclude a long term statistics entity, would that indeed be excluded from the database as I read everywhere you cannot exclude those at all.
Unfortunately, no. This is a common feature that is frequently requested on the community forums. You cannot selectively purge entities that have long-term statistics recorded in Home Assistant.
The good news is HA only records 24 entries per day per entity, which is very little.
Thank your for the nice article!
I think in understand the concept of the staggered tables: states, statististics_short_term, statistics. But when I look at my DB I see that many more entities are recorded in states than in the statistics tables. Among the missing ones, are the ones I am interested, namely the production and consumption data from my photovoltaics.
Why is that the case? Is there a filter defined somewhere that I can modify?
Energy entities should store their long-term data in the
statisticstable.Are you sure they are not excluded from the recorder?
Please correct me if I am wrong, but exporting history from HA give us one state change per hour for long term statistics (LTS). If you have a need to rebuild energy consumption sensor history (kWh) from a power sensor’s (W) LTS, this won’t work. You need the hourly mean (W) from the power sensor so that you can then rebuild the (kWh) as a total_increasing sensor.
In order to get that min/max/mean data for the state class “measurement”, I believe it will need to be extracted with SQL directly from the DB.