I wrote recently about replacing Home Assistant’s default database engine (SQLite) with a more optimized solution (MariaDB) and self-hosting it as an LXC on Proxmox. I highly suggest you read that article before moving on with this one.
While MariaDB is better than the default, it’s still an SQL relational database not optimized for long-term data retention. InfluxDB on the other hand, is a time-series database allowing you to store large volumes of timestamped data which can be quickly retrieved and analyzed when needed.
You can run both MariaDB and InfluxDB in parallel directly in Home Assistant, I’ve covered how to in this article, which also contains some general information about both and how to optimize them for Home Assistant.
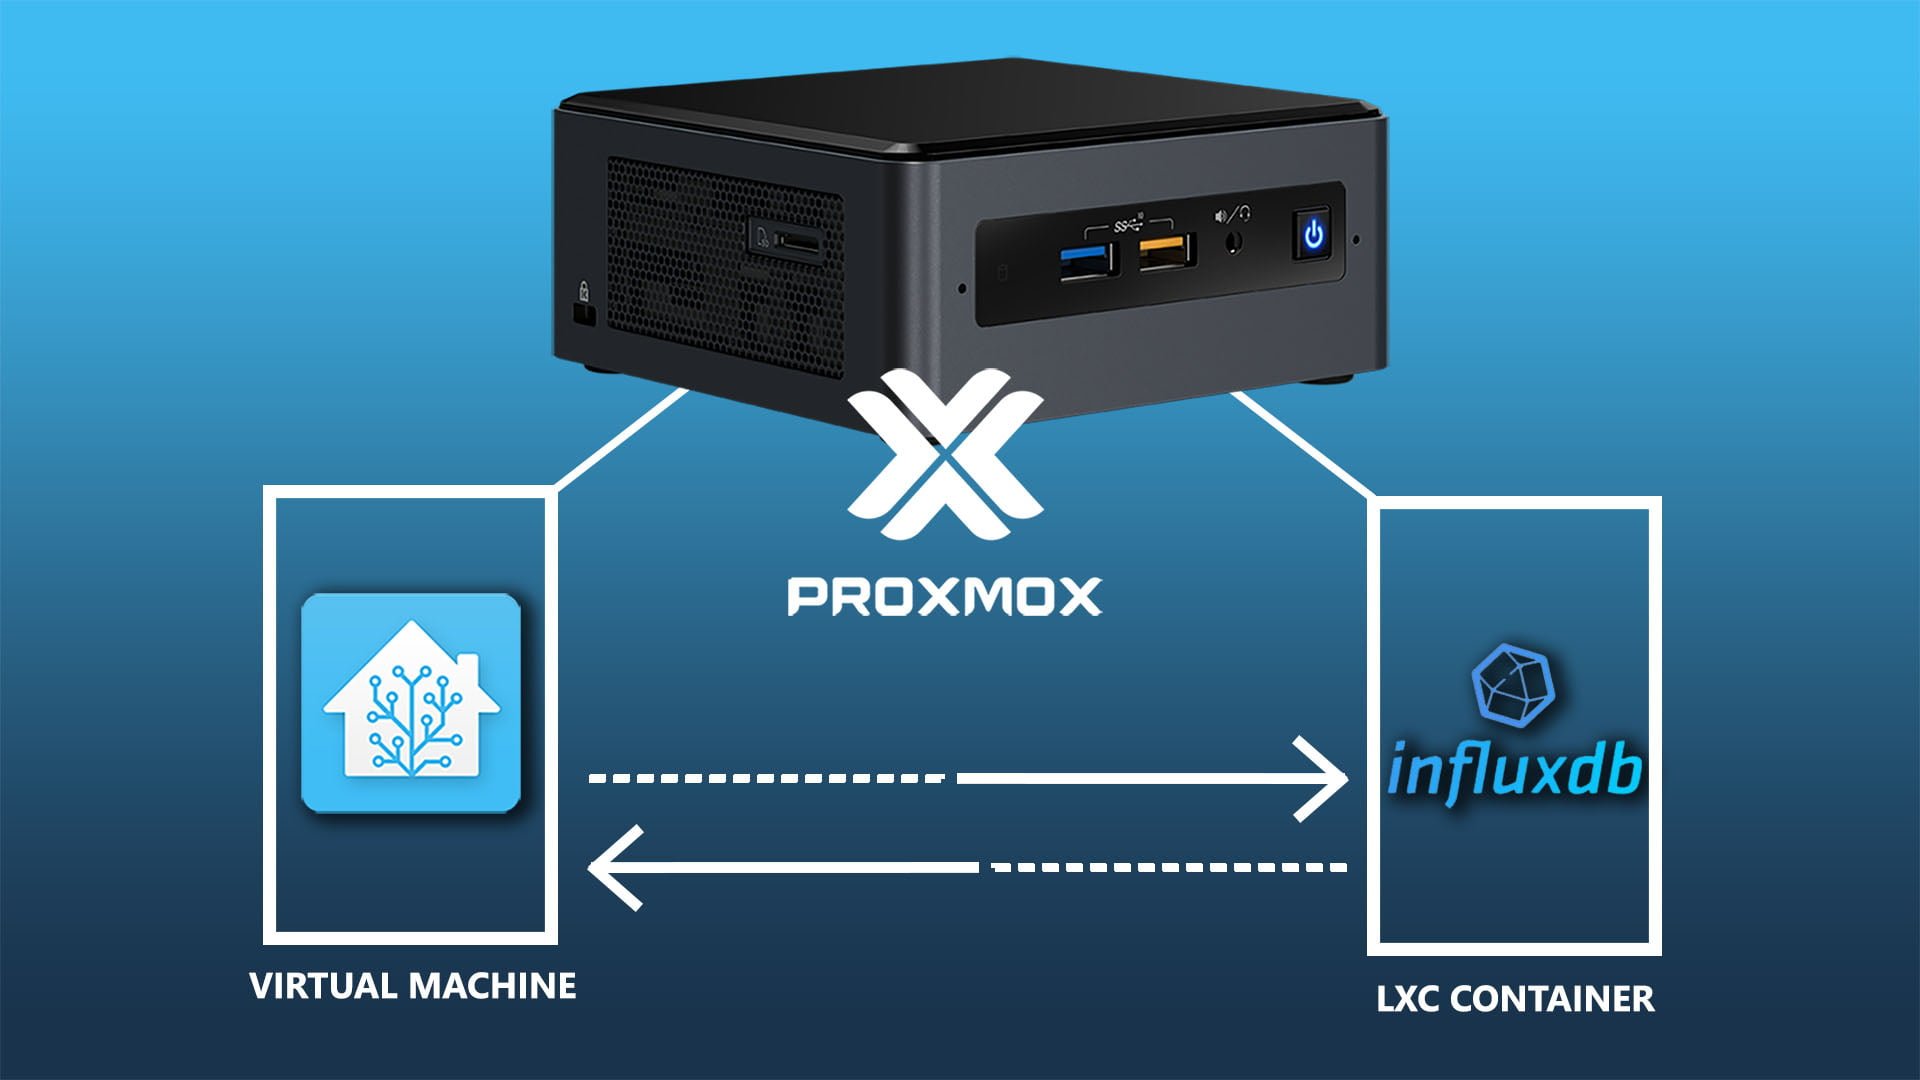
In this guide, I’m sharing how to self-host an InfluxDB V2 instance on your Proxmox server and connect Home Assistant for long-term data and history retention.
Installing InfluxDB V2 on Proxmox
To deploy InfluxDB as an LXC, we can use tteck‘s scripts in the Proxmox VE Shell, now developed by the community since his passing. I’m going to install and setup Influx V2 for the purpose of this article, although you can install V1 with the same script. Select your node on the left, click Shell in the middle column and execute the following command:
bash -c "$(curl -fsSL https://raw.githubusercontent.com/community-scripts/ProxmoxVE/main/ct/influxdb.sh)"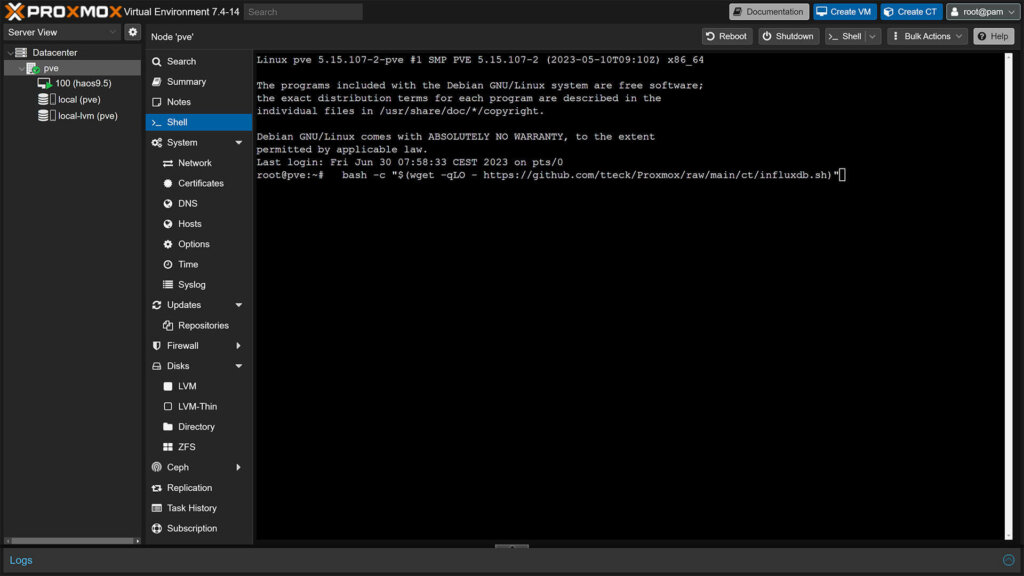
If you are running Proxmox 7, you will get a warning not to use Debian 12 LXCs. This is because InfluxDB is optimized for Debian 11 LXCs for now. Press Enter to confirm the prompt.
The Default settings are fine for the purpose of this tutorial, however if you choose Advanced you can adjust the following:
- Distribution:
- Debian (default)
- Ubuntu
- Debian Version:
- Bullseye 11 (default)
- Bookworm 12
- Container Type:
- Unprivileged (default)
- Privileged
- Set Root Password (for SSH Access)
- Automatic Login (default)
- Set Container ID
- Incremented from your list (default)
- Set Hostname
- influxdb (default)
- Set Disk Size in GB
- 4GB (default)
- Allocate CPU Cores
- 2 (default)
- Allocate RAM in MiB
- 2048 (default)
- Set a Network Brigde
- vmbr0 (default)
- Set a Static IP Address
- DHCP (default)
- Disable IPv6
- Disabled (default)
- Set Interface MTU Size
- Default (blank)
- Set DNS Search Domain
- Host (default)
- Set DNS Server IP
- Host (default)
- Set MAC Address
- Default
- Set VLAN
- Default (Blank)
- Enable Verbose Mode
- No (default)
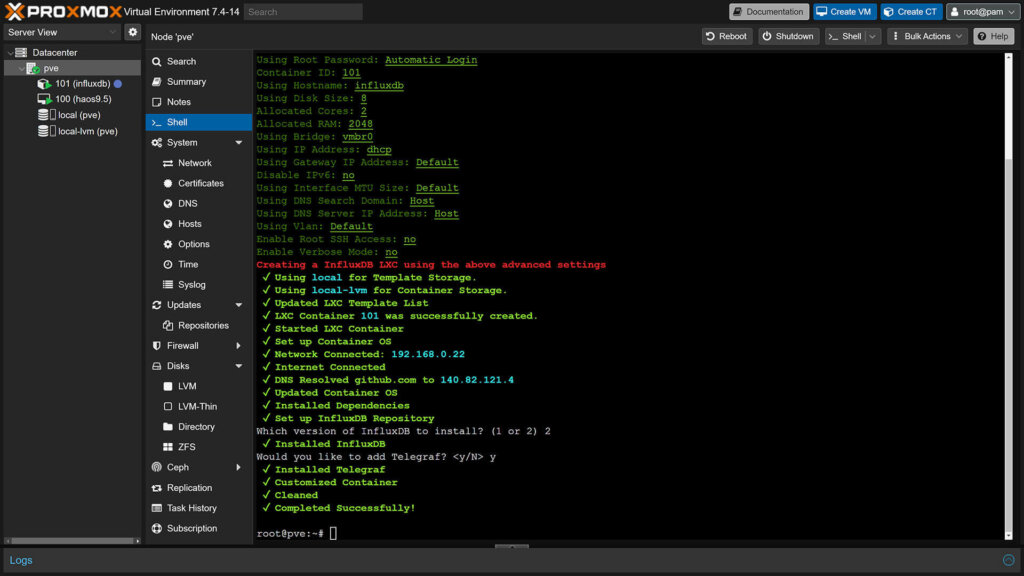
Tweak whatever settings you need and confirm the final prompt to install InfluxDB LXC. During setup, you will get two questions in the Proxmox Shell:
- Which version of InfluxDB to install? – 2
- Would like to add Telegraf? – <y/N>
Telegraf is a server agent that collects, processes, and aggregates metrics and events data from different sources, such as systems, databases, and APIs, and outputs the data to various outputs, such as InfluxDB, Prometheus, Elasticsearch, and many others.
We do not need it for Home Assistant, but you can install it if you want to tinker by answering y.
Configuring InfluxDB V2
To configure InfluxDB and actually create a database for Home Assistant, we need to access it’s web UI, which is reachable on your local network with IP_Address:8888 for V1 and IP_Address:8086 V2. If you set DHCP during installation, you can check the IP address in your router or just run the following command in Proxmox:
lxc-ls -fThis will list all your LXC container and show you the IP address for each one. Open it in a browser window along with the port and you should get a Get Started message:
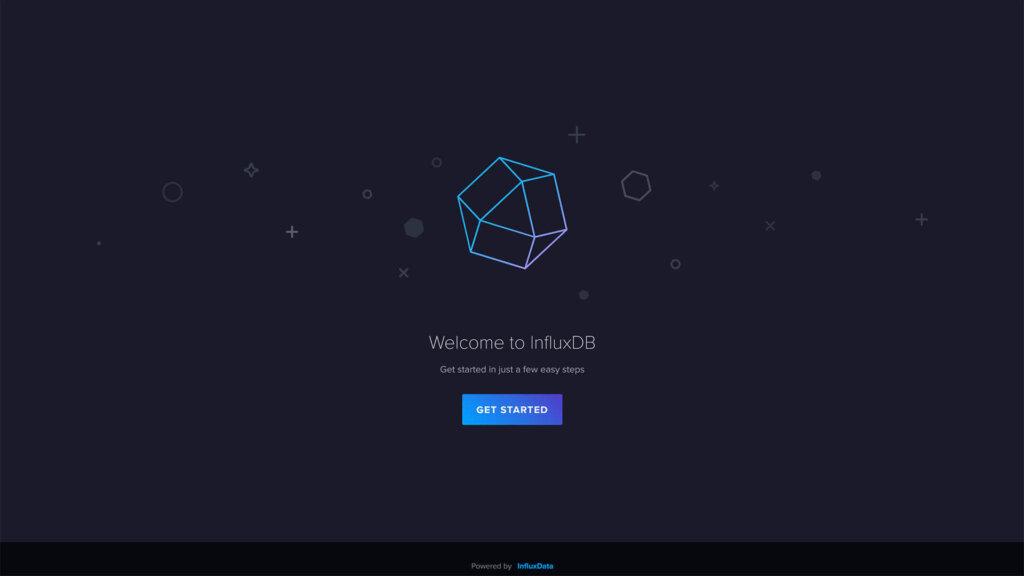
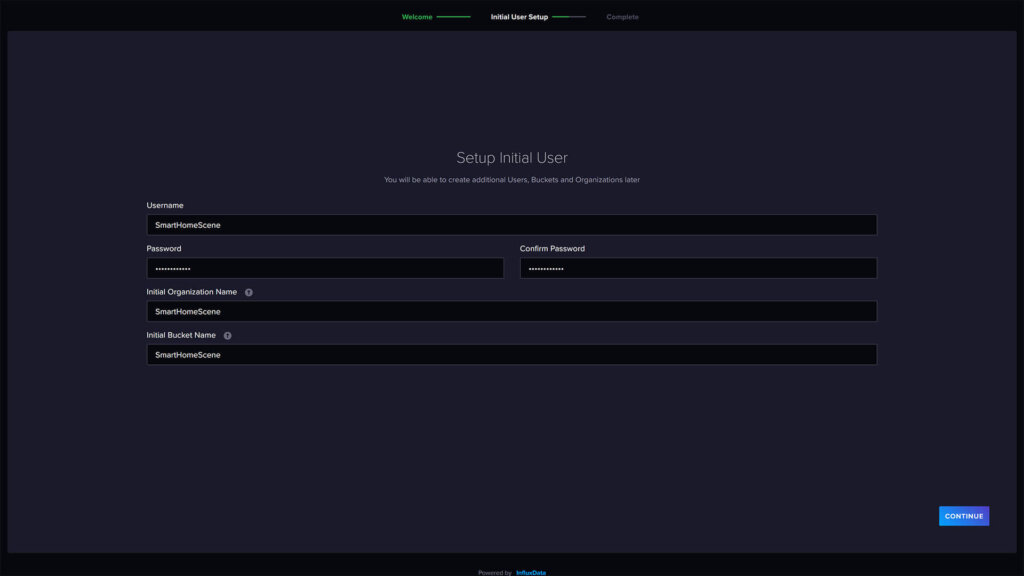
1. Click Get Started and the setup will take you to the next window where you need to create a username, password, and set Initial Organization Name and an Initial Bucket Name. Input whatever you want and make sure you remember it.
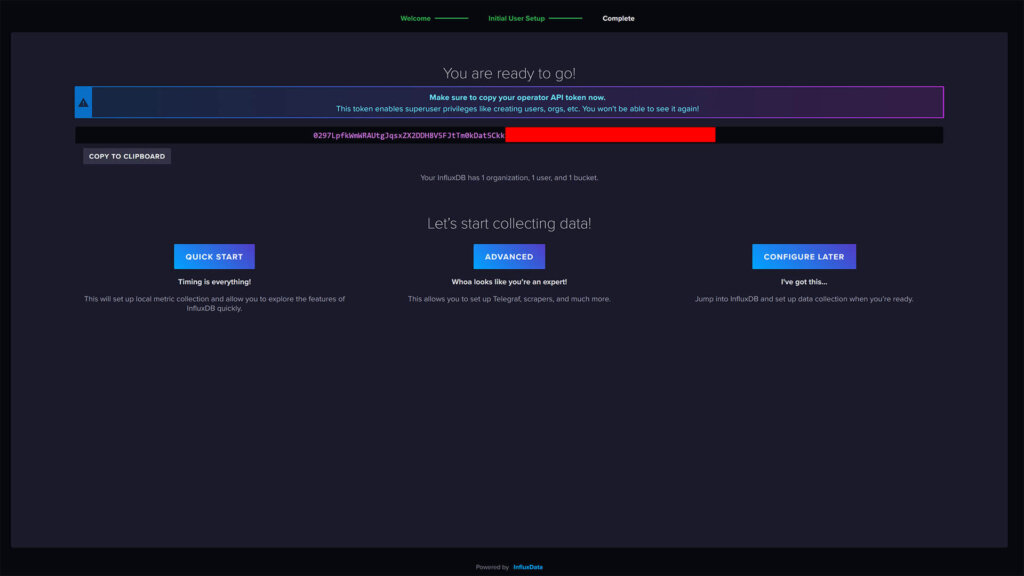
2. Influx will create an API access token for you and show it to you just once. Copy and save it in a file somewhere. Click Configure Later from the bottom menu, which will take you to InfluxDB’s UI directly.
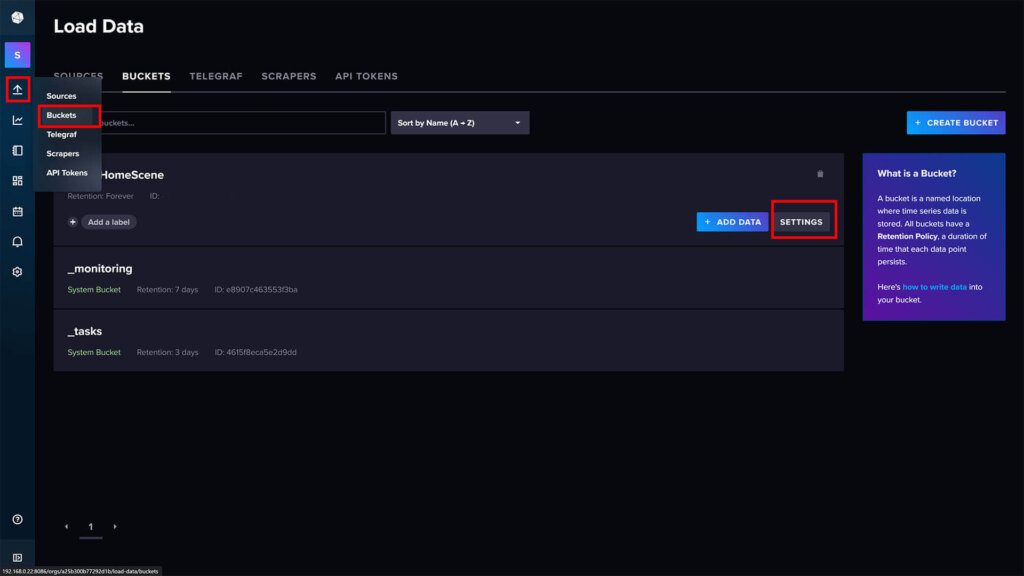
InfluxDB’s default retention policy is automatically set to forever for newly created buckets. Since the purpose of this guide is to keep data infinitely, we are going to leave it as is. If for some reason you want to change the retention policy:
3. In the menu on the left, click the Up arrow icon (Load data) and select Buckets. Under the bucket you’ve created, select Settings at the end. Change it from Forever to whatever you like and press Save Changes.
Connecting Home Assistant to InfluxDB
Once InfluxDB is setup, we can connect Home Assistant to the new database and start pushing data. The configuration for Influx cannot be set through the UI, we need to use YAML and edit the configuration file. Open the file with your favorite file editor and add the following:
#Add to configuration.yaml
influxdb:
api_version: 2
host: 192.168.0.22 #IP Address of InfluxDB LXC
ssl: false #Needs to be set to false when using HTTP
port: 8086 #Default Port of InfluxDB LXC
token: [TOKEN] #Without Brackets
organization: [ORGANIZATION ID] #Without Brackets
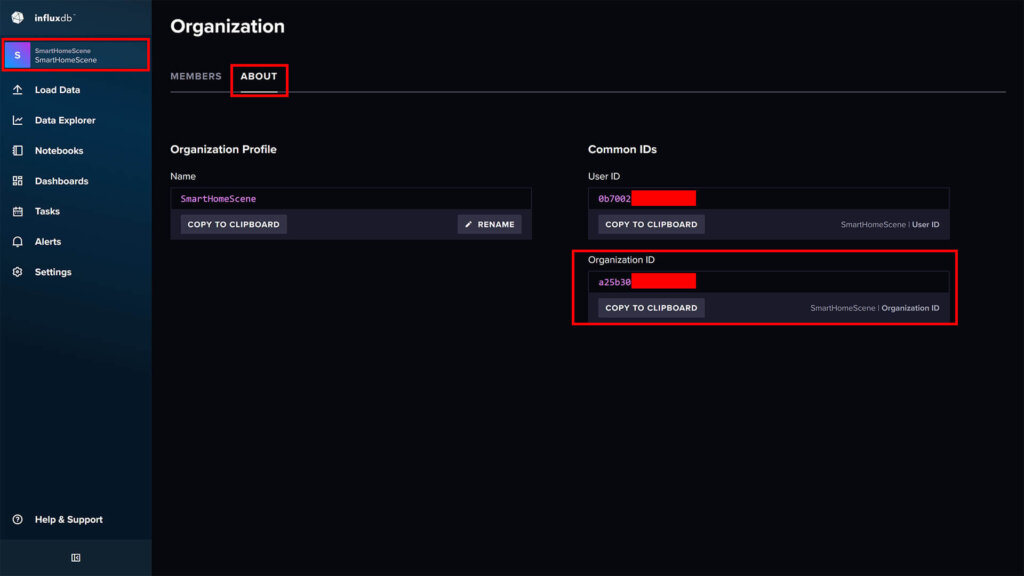
bucket: SmartHomeScene #Bucket name, not IDUnder token, paste the API token you saved during initial configuration. You can create a new one in Load Data > API Tokens if you need to. To find your organization ID, click your Username in Influx and select the About tab at the top.
Once you’ve edited the configuration correctly, save it and restart Home Assistant. When it comes back online, we can check if Home Assistant is actually feeding data to the InfluxDB database. Open the InfluxDB interface and click Data Exporer on the left. Select your Bucket and you should see your entities listed:
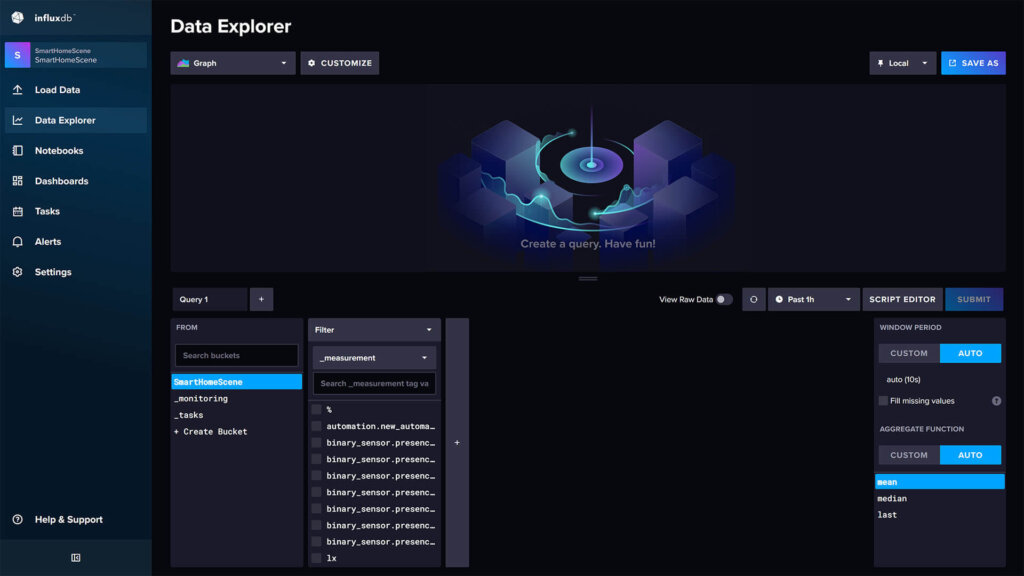
That’s it, InfluxDB will record and keep your Home Assistant history per your retention policy.
Optimizing Entities for Long-Term History Keeping
By default, Home Assistant will push history and logs for each and every entity you have. This is absolutely not necessary, especially for long-term data keeping. You would not want to know what your host CPU usage was 6 months ago.
To setup and filter which entities are actually recorded in InfluxDB, we can tweak the configuration.yaml file by using includes or excludes. I’ve covered this extensively in my Optimize Your Home Assistant Database guide and it’s still applicable for this guide. As an example, here’s how you can include only a few entities:
influxdb:
  api_version: 2
  host: 192.168.0.22
  ssl: false
  port: 8086
  token: [TOKEN]
  organization: [ORGANIZATION ID]
  bucket: SmartHomeScene
  include:
    entities:
      - sensor.total_energy
    entity_globs:
      - binary_sensor.*_occupancy
    domains:
      - light
You can manually list entities, entity_globs (entities of the same type, e.g. occupancy) or entire domains in your include policy. This will record only things that you listed here and exclude everything else. If you replace include with exclude, the opposite will occur: everything will be recorded except things you excluded.
Analyzing Data
There are many tools available than you can use to actually view and analyze data recorded in an InfluxDB database. One of those tools is a popular graphing and charting web app called Grafana. You can run it along side InfluxDB on your Proxmox server and create all kinds of analytics dashboards.
Grafana is a complex tool which requires a tutorial of it’s own, so for now I will cover two ways you can analyze data: InfluxDB’s Data Explorer and creating queries in Home Assistant itself.
InfluxDB V2 Data Explorer
I found that InfluxDB has a sophisticated graphing toolset by itself so I’m going to share a few examples of creating graphs and charts with it. You can go over the full documentation on their official website. For example, let’s say I want to chart the sun’s elevation for the past 2 days:
- Click Data Explorer on the left
- Select the Bucket (Database name)
- In the first filter, select entity_id
- Select the sun entity
- In the second filter, select elevation
- Select the time range (Past 2d)
- Click Submit
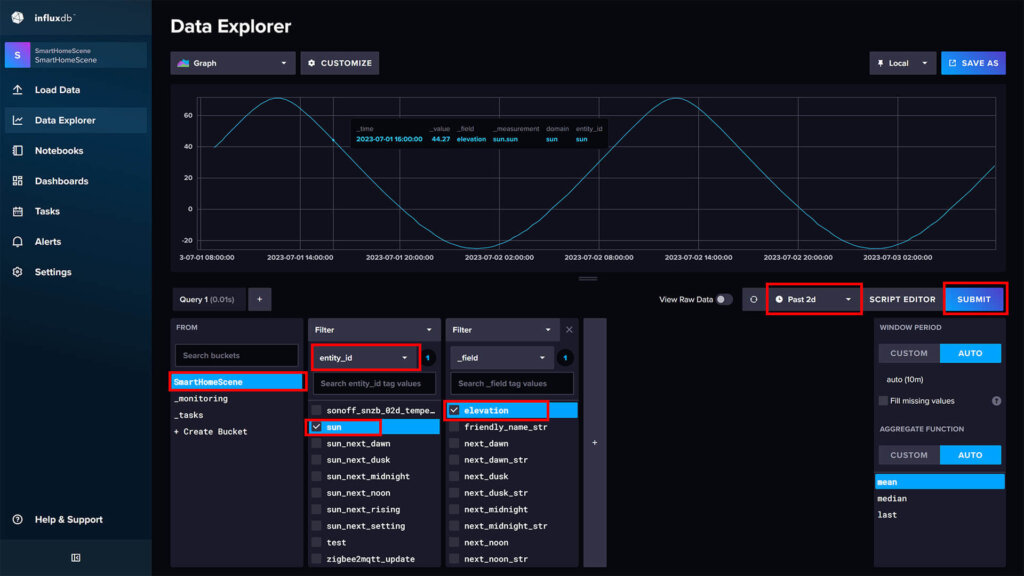
This will execute a simple query and chart the sun’s elevation in a line graph for the desired period. Hovering on the chart will give you a timestamp with the exact elevation. You can click Save as at the top and save this chart to a dashboard in InfluxDB.
As a second example, let’s say I want to chart the illumination recorded for the past 2 days in my office. The reading is provided from the Aqara FP2 Presence Sensor:
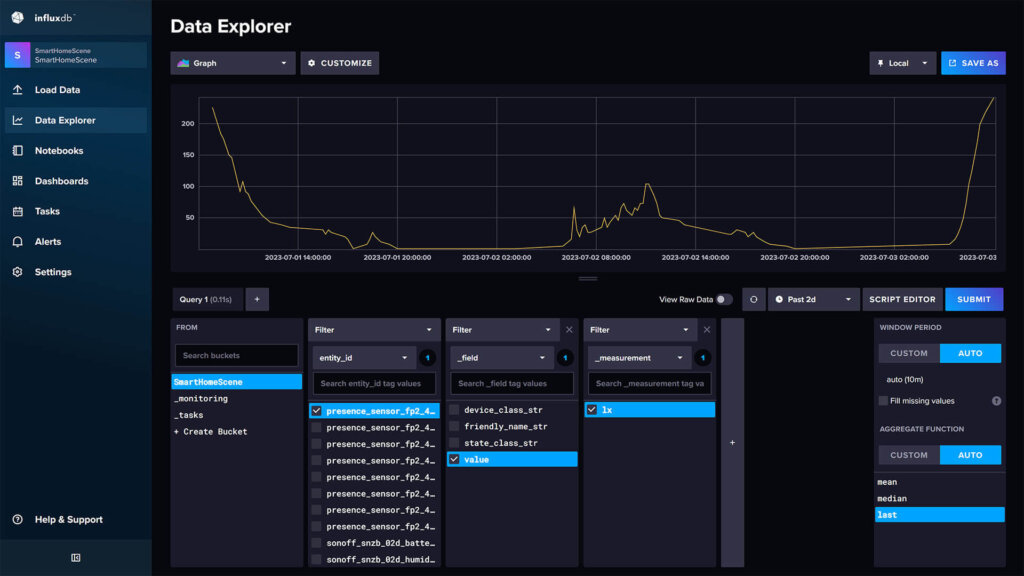
If you click Script Editor, you can see the actual query automatically populated in InfluxDB’s Flux language. While this maybe familiar to some, others are going to find it a complete novelty. I found that most results can be easily achieved by simply using the UI and creating graphs and charts without typing out the query. Here’s an example of how it looks in the background:
from(bucket: "SmartHomeScene")
  |> range(start: v.timeRangeStart, stop: v.timeRangeStop)
  |> filter(fn: (r) => r["entity_id"] == "presence_sensor_fp2_4bc0_light_sensor_light_level")
  |> filter(fn: (r) => r["_field"] == "value")
  |> filter(fn: (r) => r["_measurement"] == "lx")
  |> aggregateWindow(every: v.windowPeriod, fn: last, createEmpty: false)
  |> yield(name: "last")
I noted earlier InfluxDB is very capable of creating all sorts of graphs and charts from the data you are feeding to it. Aside a simple line graph, it can display information in a band, gauge, graph + single stats, heatmap, histogram, mosaic, scatter, tables and single stats.
You can customize the appearance of the graph by clicking the Customize button at the top. There are a bunch of settings you can change regarding the X/Y axis, legend and colors.
Different graph types are more suitable to use for different data, it will largely depend on what you are trying to chart and analyze. Feel free to experiment and click around, nothing is saved until you click the Save as button at the top.
InfluxDB V2 Queries in Home Assistant
We can create InfluxDB queries and exposes them as sensors in Home Assistant. This can allow you to retrieve analytical data from InfluxDB that is not normally available in Home Assistant. Whether or not you will find something actually useful to expose as a sensor will depend on your use case and available entities.
InfluxDB V2 supports queries only in their Flux language, which are not so easily created. You can use the query explorer in InfluxDB’s Web UI to tinker and create a custom query which you can later add to Home Assistant. Here are a couple of examples from the official Home Assistant InfluxDB integration:
sensor:
  - platform: influxdb
    api_version: 2
    token: GENERATED_AUTH_TOKEN
    organization: RANDOM_16_DIGIT_HEX_ID
    bucket: BUCKET_NAME
    queries_flux:
      - range_start: "-1d"
        name: "How long have I been here"
        query: >
          filter(fn: (r) => r._domain == "person" and r._entity_id == "me" and r._value != "{{ states('person.me') }}")
          |> map(fn: (r) => ({ _value: r._time }))
        value_template: "{{ relative_time(strptime(value, '%Y-%m-%d %H:%M:%S %Z')) }}"
      - range_start: "-1d"
        name: "Cost of my house today across all power sensor"
        query: >
          filter(fn: (r) => r.domain == "sensor" and r._field == "value" and regexp.matchRegexpString(r: /_power$/, v: r.entity_id))
          |> keep(columns: ["_value", "_time"])
          |> sort(columns: ["_time"], desc: false)
          |> integral(unit: 5s, column: "_value")
        imports: regexp
        value_template: "{{ value|float / 24.0 / 1000.0 * states('sensor.current_cost_per_kwh')|float }}"
      - range_start: "-1d"
        bucket: Glances Bucket
        name: "Average CPU temp today"
        query: "filter(fn: (r) => r._field == \"value\" and r.entity_id == \"glances_cpu_temperature\")"
        group_function: mean
It was my intention to create an InfluxDB database size sensor in Home Assistant. While this was easy in V1, apparently it’s completely the opposite with V2. I managed to follow through with a hacky workaround shared on the community forums, although it requires the SSH & Terminal Add-on as well.
Summary
There are few things I would like to make clear about InfluxDB, MariaDB and Home Assistant. Even though I’ve written about these throughout my guides and articles, here’s a summary of these two database engines and their utility with Home Assistant:
- InfluxDB is a time-series database
- InfluxDB can run in parallel with MariaDB or SQLite (default)
- InfluxDB does NOT replace the default Home Assistant database
- MariaDB is a relational database
- MariaDB replaces the default SQLite Home Assistant database
- MariaDB is an optimized drop-in replacement for SQLite
- You can run both as add-ons directly in Home Assistant
- Installing MariaDB Add-on
- Installing InfluxDB Add-on
- You can run both as LXC containers in Proxmox
- Installing MariaDB LXC Container
- Installing InfluxDB LXC Container [This article]
Once everything is configured properly, you can keep your Home Assistant history forever with InfluxDB and use MariaDB as your day-to-day database with a short retention policy in Home Assistant. Even though the default data explorer of InfluxDB is powerful enough, you might find Grafana easier and more suitable for exploring and analyzing data.


Hi, great tutotrial
is it posible to have booth on HA ?
host: a0d7b954-influxdb
host: 192.168.100.42
or how i import old influxDB to the new one ?
Are you still using InfluxDB after 2023.12.0?
https://www.home-assistant.io/blog/2023/12/06/release-202312/#history-dashboard-showing-long-term-statistics
Yes, since I offload the database to an InfluDB LXC running on Proxmox.
This is a long-term history keeping solution, without any data loss.
Home Assistant’s long-term statistics downsamples hourly data and abbreviates it to median single points.
This is enough for most people, not for data freaks like me.