In a series of Proxmox guides a while back, I talked about monitoring and controlling your Proxmox Virtual Environment from Home Assistant. Using the custom component used in that article allows you to monitor the host disk usage, CPU usage, memory usage and remotely reboot or shutdown the VM or container.
One thing that’s missing from the custom integration in question (and similar ones) is the ability to monitor host temperatures (CPU, Chipset, Disk etc.). Glances can be used as an alternative, although that involves actually running Glances on the Proxmox host.

About this guide
There are many ways to monitor temperatures of a Proxmox host, but the solution I’m sharing in this guide is the easiest method I’ve found for monitoring Proxmox CPU, Chipset and Disk temperatures, relying on a simple script and a cron job.
In my opinion, there is no need to install additional services and deploy elaborate and convoluted methods for monitoring host temperatures. This article uses a modified script which you can find here, props to Daniel Stein (dmslabsbr) for creating and sharing it.
I’m running Proxmox on a Beelink EQ12 Pro Mini PC [AliExpress, Amazon] with an N305 processor, and depending on your hardware you will have different sensors exposed by the lm-sensors package used in this script.
Installing the lm-sensors Package
The lm-sensors package is a free and open-source application that provides tools and drivers for monitoring temperatures, voltage, fans and hardware health of Linux systems like Proxmox. The script used in this guide relies on this package, so installing it on your Proxmox node is the first requirement. In Proxmox, select your node on the left, select Shell and execute the following command:
apt-get install lm-sensors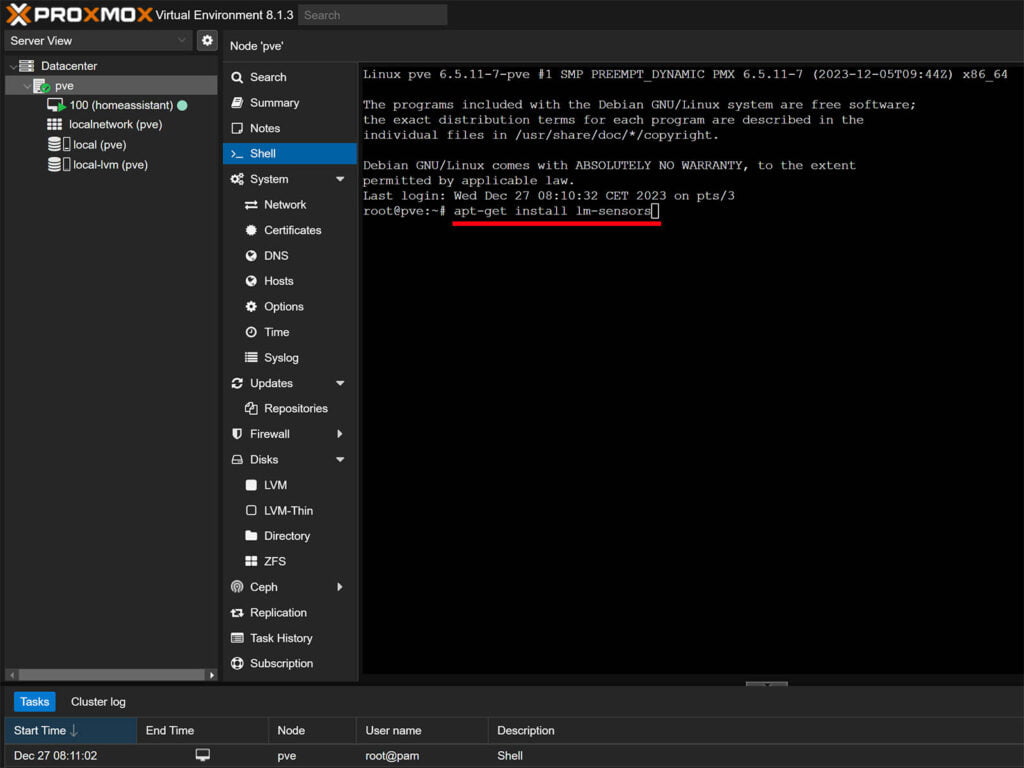
The command will install any required dependencies and the lm-sensors package in less than 15 seconds. On newer systems, such as Ubuntu 22.04+ you need to execute an additional command to get the HDD temperature, using hwmon and load it on every reboot automatically:
sudo modprobe drivetemp
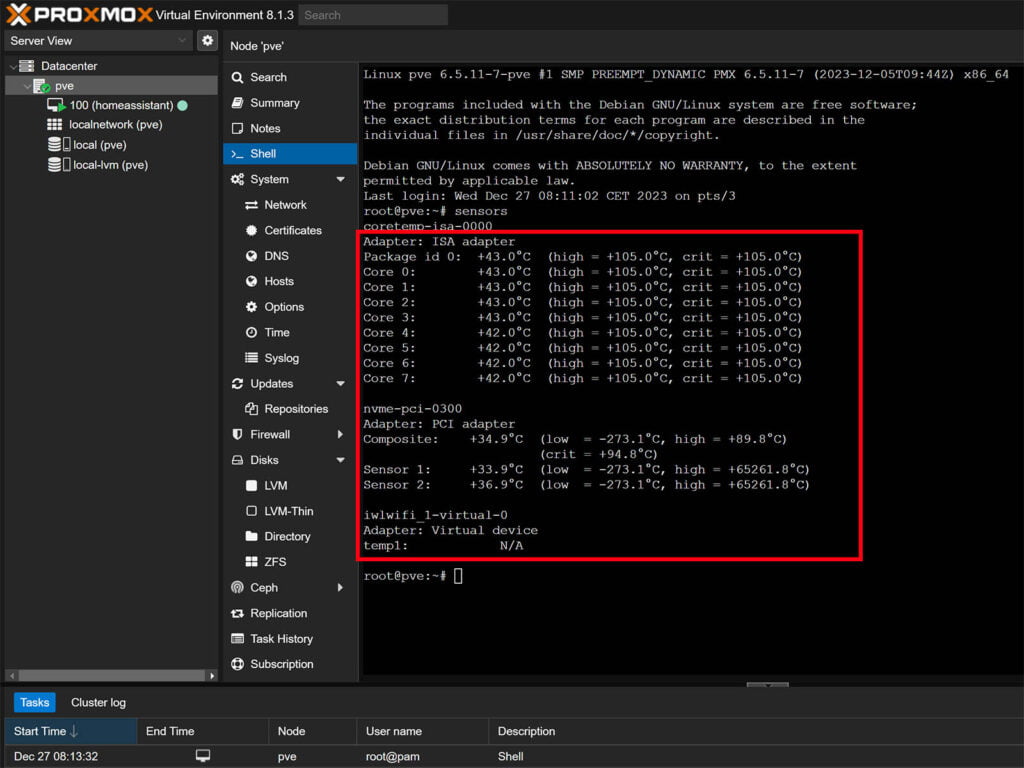
echo drivetemp | sudo tee -a /etc/modulesTo get an output from the readings, execute command sensors and you will notice a few different blocks depending on your hardware. I’m doing this on a the awesome Beelink EQ12 Pro Mini PC which gave me temperature of the CPU and NVME drive, but not the chipset since it’s not supported by lm-sensors.
Creating a long-lived access token
For organizing technical access to Home Assistant at the system, long-lived tokens are used for sending and receiving different data. We need to create a token in Home Assistant, which will be added to the sensors script in Proxmox.
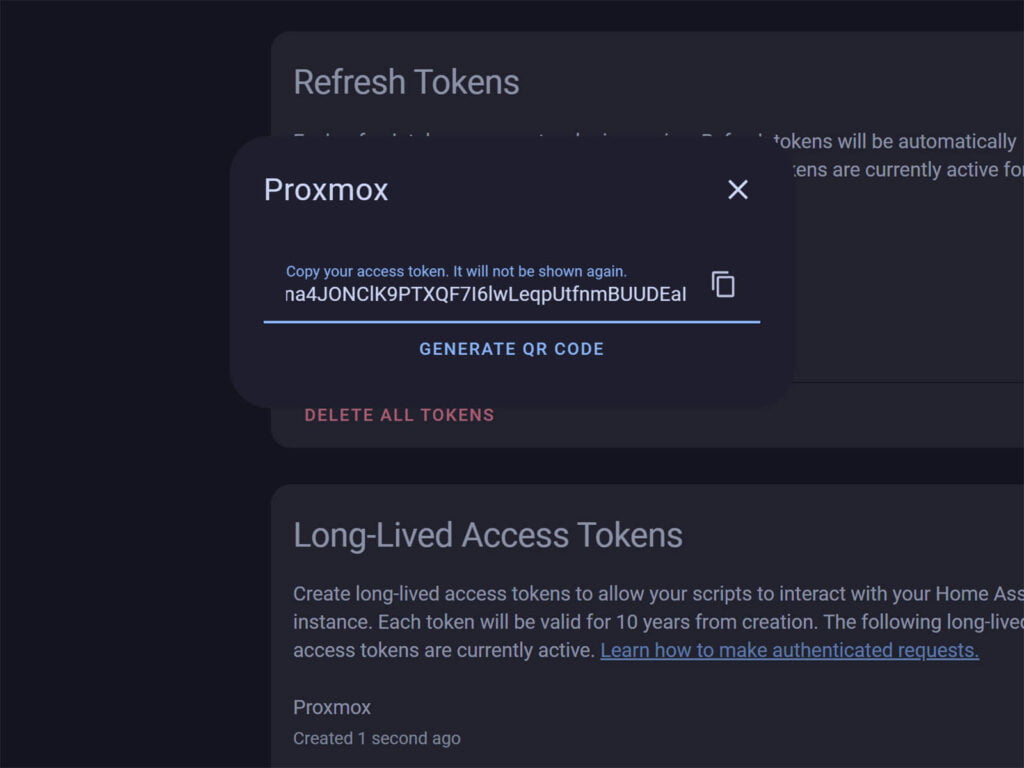
In HA, click your profile at the left and scroll down to Long-Lived Access Tokens. Click Create Token, give it a name and copy the generated character string. Long-lived access tokens are only shown once, so save it in a notepad file or something so you don’t forget it.
Creating the sensors script
The next step is to create the sensors script in Proxmox which will be used to read and send data from the lm-sensors package to Home Assistant. Select your node on the left pane in Proxmox, click Shell in middle, and execute the following command:
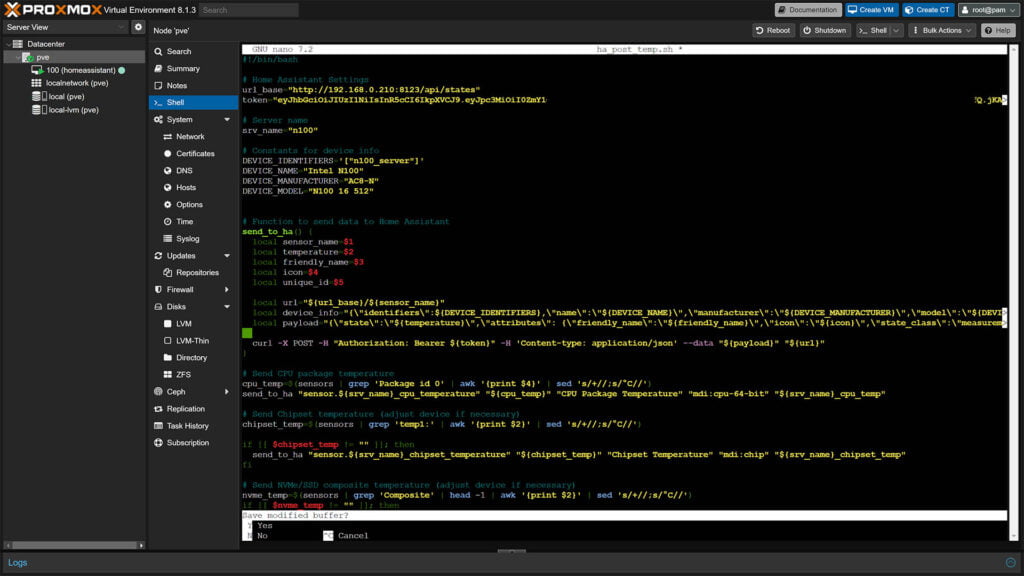
nano ha_post_temp.shThis will open an empty file in the root directory of your host using the nano editor. Paste the following content and edit the url_base and token to match your Home Assistant local IP address and the long-lived access token you just created. Optionally, you can change the srv_name which will be used as a prefix for all created sensors in Home Assistant (e.g. sensor.pve_cpu_temperature)
#!/bin/bash

# Home Assistant Settings
url_base="http://192.168.0.123:8123/api/states"
token="asdfaGDfdsgfcCI6IkpX-dUrka1Eis"

# Server name
srv_name="pve"

# Constants for device info
DEVICE_IDENTIFIERS='["n100_server"]'
DEVICE_NAME="Intel N100"
DEVICE_MANUFACTURER="AC8-N"
DEVICE_MODEL="N100 16 512"


# Function to send data to Home Assistant
send_to_ha() {
  local sensor_name=$1
  local temperature=$2
  local friendly_name=$3
  local icon=$4
  local unique_id=$5

  local url="${url_base}/${sensor_name}"
  local device_info="{\"identifiers\":${DEVICE_IDENTIFIERS},\"name\":\"${DEVICE_NAME}\",\"manufacturer\":\"${DEVICE_MANUFACTURER}\",\"model\":\"${DEVICE_MODEL}\"}"
  local payload="{\"state\":\"${temperature}\",\"attributes\": {\"friendly_name\":\"${friendly_name}\",\"icon\":\"${icon}\",\"state_class\":\"measurement\",\"unit_of_measurement\":\"°C\",\"device_class\":\"temperature\",\"unique_id\":\"${unique_id}\"},\"device\":${device_info}}"

  curl -X POST -H "Authorization: Bearer ${token}" -H 'Content-type: application/json' --data "${payload}" "${url}"
}

# Send CPU package temperature
cpu_temp=$(sensors | grep 'Package id 0' | awk '{print $4}' | sed 's/+//;s/°C//')
send_to_ha "sensor.${srv_name}_cpu_temperature" "${cpu_temp}" "CPU Package Temperature" "mdi:cpu-64-bit" "${srv_name}_cpu_temp"

# Send Chipset temperature (adjust device if necessary)
chipset_temp=$(sensors | grep 'temp1:' | awk '{print $2}' | sed 's/+//;s/°C//')

if [[ $chipset_temp != "" ]]; then
  send_to_ha "sensor.${srv_name}_chipset_temperature" "${chipset_temp}" "Chipset Temperature" "mdi:chip" "${srv_name}_chipset_temp"
fi

# Send NVMe/SSD composite temperature (adjust device if necessary)
nvme_temp=$(sensors | grep 'Composite' | head -1 | awk '{print $2}' | sed 's/+//;s/°C//')
if [[ $nvme_temp != "" ]]; then
  send_to_ha "sensor.${srv_name}_nvme_temperature" "${nvme_temp}" "NVMe/SSD Temperature" "mdi:harddisk" "${srv_name}_nvme_temp"
fi

# Send GPU temperature (adjust device if necessary)
gpu_temp=$(sensors | grep 'GPU Temp' | awk '{print $2}' | sed 's/+//;s/°C//')
if [[ $gpu_temp != "" ]]; then
  send_to_ha "sensor.${srv_name}_gpu_temperature" "${gpu_temp}" "GPU Temperature" "mdi:gpu" "${srv_name}_gpu_temp"
fi
In the nano editor, you use mouse right-click or Shift+Ctrl+V to paste the long-lived-access token. Alternatively, you can edit the script in Notepad++ or similar and paste the whole thing once. Once you are done editing the file, you need to save it by pressing CTRL + X and confirming with Y + Enter. Your edited file should look like this:
Once you’ve saved the file, we need to make it executable. In the Proxmox Shell, execute the following command:
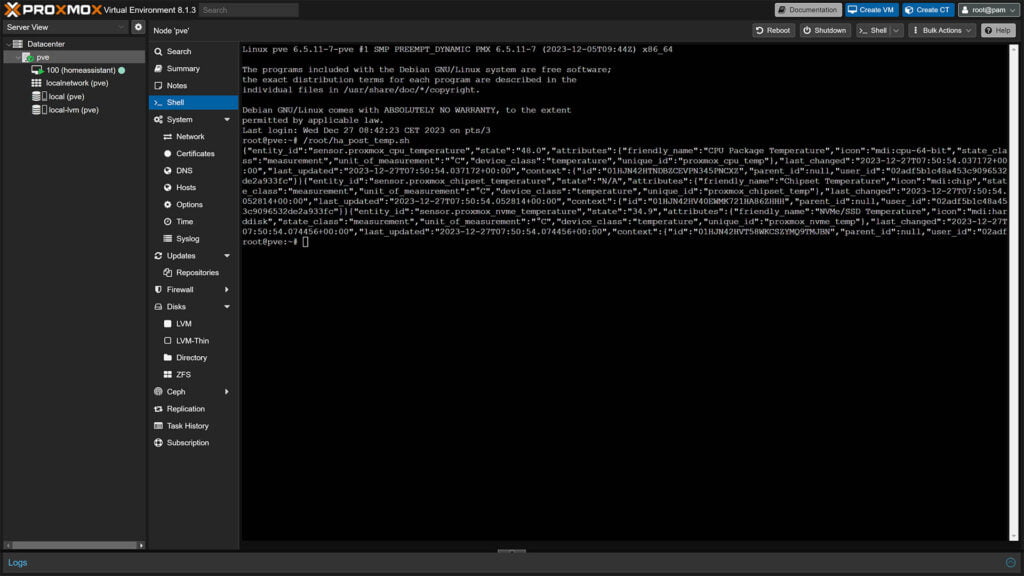
chmod +x ha_post_temp.shTo check the output of the script, run the following command:
/root/ha_post_temp.shIf you get a sensors parsing similar to this, you are good so far and you can proceed:
Creating a automated cronjob
The final step is to create an automated cronjob which will run at a specified schedule, updating the sensors and sending them to Home Assistant. In the Proxmox Shell, execute the following command and if you are asked for choosing an editor, select 1 for nano.
crontab -e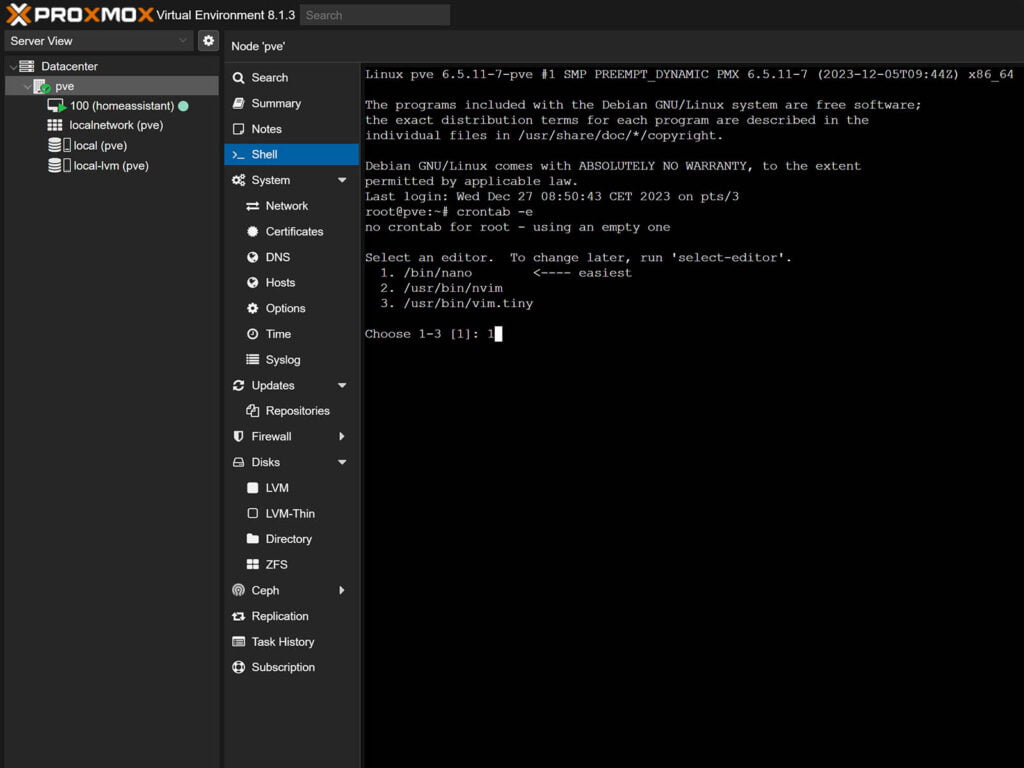
Assuming you have no other cronjobs running, the shell will output no crontab for root. In the opened nano editor, paste the following code which will make the script run once per minute:
*/1 * * * * /root/ha_post_temp.shYou can change it to more if you need to (e.g. 5 minutes):
*/5 * * * * /root/ha_post_temp.shSave the file with CTRL + X and confirming with Y + Enter. All that remains is to restart the cron service and check it’s status with the following commands in the Proxmox Shell:
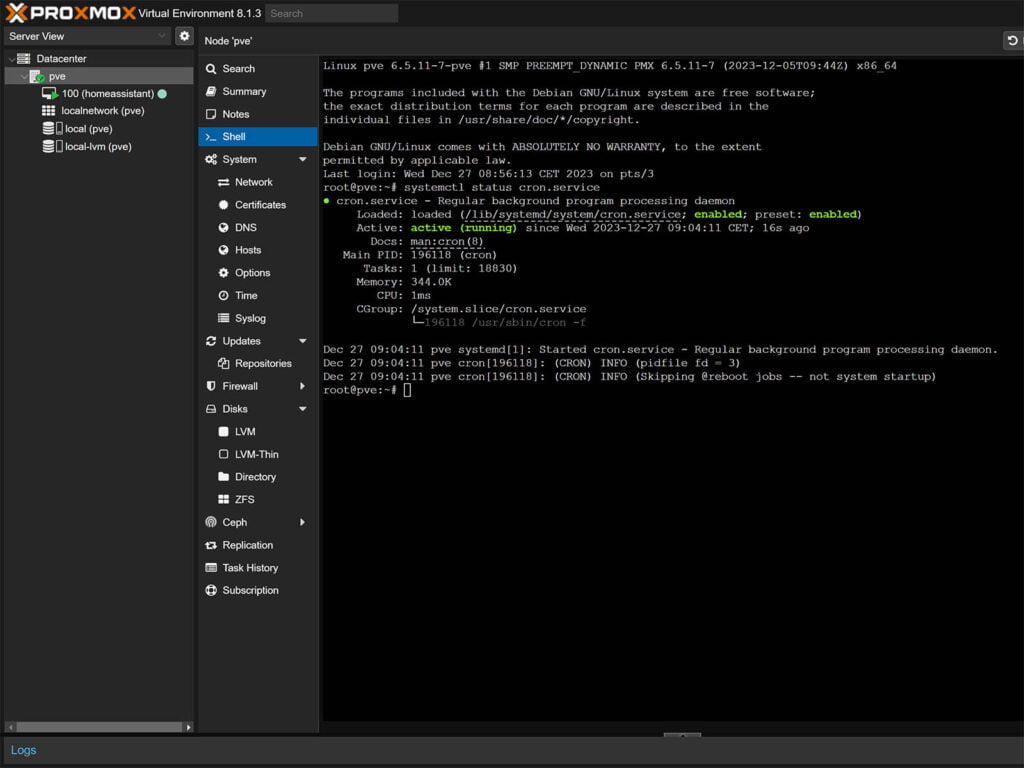
systemctl restart cron.service

systemctl status cron.service
If you get an output with active (running), you have successfully enabled the cronjob for the sensors script.
Temperature Sensors in Home Assistant
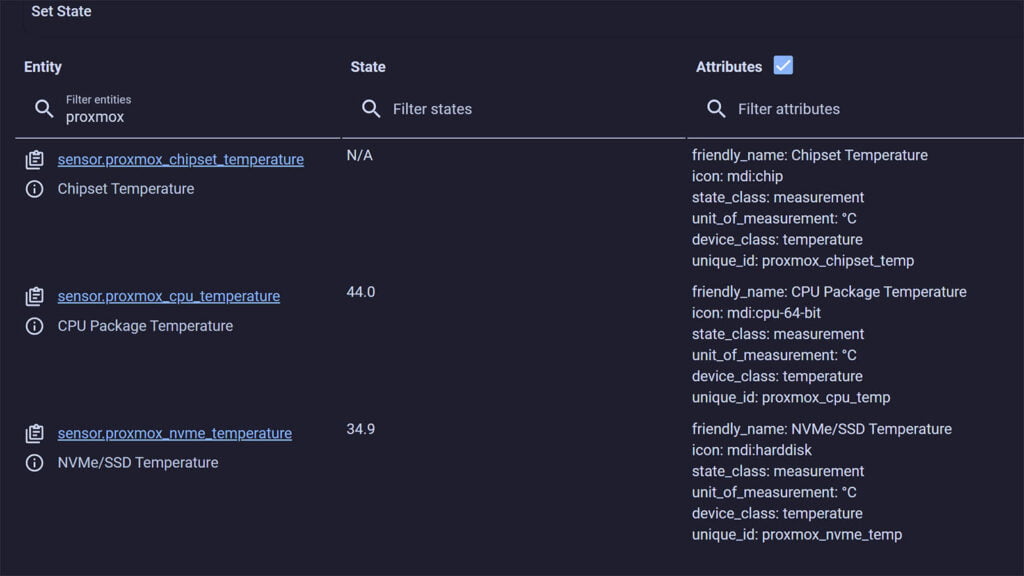
The sensors are automatically added to Home Assistant without any additional steps. If you navigate to Developer Tools > States you can see their data being pushed every minute, per the sensors script:
Here’s a list of other Proxmox and Home Assistant related articles we’ve written:
- How To Install Home Assistant on Proxmox: The Easy Way
- How to Separate Zigbee2MQTT from Home Assistant in Proxmox
- How To Backup Home Assistant In Proxmox
- How to Monitor and Control Proxmox Virtual Environment in Home Assistant
- Moving Home Assistant’s Database to MariaDB on Proxmox
- How To Keep Home Assistant History Infinitely with InfluxDB on Proxmox
- How To Passthrough USB Devices To Home Assistant in Proxmox


Hi,
Interesting. I just started to try this, but when running the script, always get this as a reply:
┌──(root💀proxmoxone)-[~]
└─# /root/ha_post_temp.sh
curl: (52) Empty reply from server
curl: (52) Empty reply from server
curl: (52) Empty reply from server
What is going south here?
This seems like a firewall or network config issue.
Are u using PiHole or something?
Yes, PiHole is in use. But even when I disable my PiHole, I keep on getting the same empty replies from server. And I do not have any firewall rule blocking any traffic between my proxmox server and my home assistant…
I’m shooting in the dark here, since that curl error is very generic but:
apt updateapt full-upgrade
Reboot Proxmox and retry.
Seeing the same on my end here:
root@proxmox:~# /root/ha_post_temp.sh
curl: (52) Empty reply from server
curl: (52) Empty reply from server
Running AdGuard Home, but not seeing anything blocked in the query logs.
Running ‘sensors’:
root@proxmox:~# sensors
iwlwifi_1-virtual-0
Adapter: Virtual device
temp1: N/A
pch_skylake-virtual-0
Adapter: Virtual device
temp1: +46.0°C
drivetemp-scsi-0-0
Adapter: SCSI adapter
temp1: +38.0°C (low = +0.0°C, high = +70.0°C)
(crit low = +0.0°C, crit = +70.0°C)
(lowest = +31.0°C, highest = +49.0°C)
coretemp-isa-0000
Adapter: ISA adapter
Package id 0: +54.0°C (high = +84.0°C, crit = +100.0°C)
Core 0: +51.0°C (high = +84.0°C, crit = +100.0°C)
Core 1: +51.0°C (high = +84.0°C, crit = +100.0°C)
Core 2: +52.0°C (high = +84.0°C, crit = +100.0°C)
Core 3: +51.0°C (high = +84.0°C, crit = +100.0°C)
I’m shooting in the dark here, since that curl error is very generic but:
apt updateapt full-upgrade
Reboot Proxmox and retry.
Happy New Year! 😉
If only it would be that simple…
I get an “401: Unauthorized” when I browse to //<IP ADDRESS:8123/api/states, so it has something to do with the authorisation part of this story.
You are getting an unauthorized error because you are not parsing the Long Lived Access token with the browser request.
Please see this:
https://smarthomescene.com/guides/easy-way-to-monitor-proxmox-host-temperatures-in-home-assistant/#comment-8468
Same for me:
root@pve:~# /root/ha_post_temp.sh
curl: (52) Empty reply from server
curl: (52) Empty reply from server
curl: (52) Empty reply from server
i ran the apt update and full-upgrade but same results
i don’t use pihole or adguard…
Like I mentioned in an earlier comment, one possibility is a network misconfiguration (e.g. firewall, router, other network infrastructure).
“Empty reply from server” simply means it’s not getting a response at all when you are trying to reach your Home Assistant instance from Proxmox, it has nothing to do with the script.
Are you using Home Assistant on a secure connection with an SSL certificate (https)?
Perhaps local access is disabled (http)? Are you using NGINX? Are you using a redirect?
There can be many causes, it’s hard to pinpoint without knowing your network setup.
Can you try to modify the curl command inside the script?
Open the script with nano again:
nano ha_post_temp.shIn the middle, find the CURL command and change it from
CURL -XtoCURL -LRun
/root/ha_post_temp.shagainLet me know what the output gives you.
This is what is shows now with a CURL -L:
┌──(root💀proxmoxone)-[~]
└─# /root/ha_post_temp.sh
curl: (6) Could not resolve host: POST
curl: (52) Empty reply from server
curl: (6) Could not resolve host: POST
curl: (52) Empty reply from server
curl: (6) Could not resolve host: POST
curl: (52) Empty reply from server
Please see this:
https://smarthomescene.com/guides/easy-way-to-monitor-proxmox-host-temperatures-in-home-assistant/#comment-8468
When I add a -v (verbose) tag to the curl line in the script, I get this output (token and IP address tweaked):
┌──(root💀proxmoxone)-[~]
└─# /root/ha_post_temp.sh
Note: Unnecessary use of -X or –request, POST is already inferred.
* Trying 10.10.xx.xx:8123…
* Connected to 10.10.xx.xx (10.10.xx.xx) port 8123 (#0)
> POST /sensor.proxmoxone_cpu_temperature HTTP/1.1
> Host: 10.10.xx.xx:8123
> User-Agent: curl/7.88.1
> Accept: */*
> Authorization: Bearer eyJhbGciOiJIUzI1NiIsInR5cCI
> Content-type: application/json
> Content-Length: 336
>
* Empty reply from server
* Closing connection 0
curl: (52) Empty reply from server
Note: Unnecessary use of -X or –request, POST is already inferred.
* Trying 10.10.xx.xx:8123…
* Connected to 10.10.xx.xx (10.10.xx.xx) port 8123 (#0)
> POST /sensor.proxmoxone_chipset_temperature HTTP/1.1
> Host: 10.10.xx.xx:8123
> User-Agent: curl/7.88.1
> Accept: */*
> Authorization: Bearer eyJhbGciOiJIUzI1NiIsInR5cCI
> Content-type: application/json
> Content-Length: 341
>
* Empty reply from server
* Closing connection 0
curl: (52) Empty reply from server
Note: Unnecessary use of -X or –request, POST is already inferred.
* Trying 10.10.xx.xx:8123…
* Connected to 10.10.xx.xx (10.10.xx.xx) port 8123 (#0)
> POST /sensor.proxmoxone_nvme_temperature HTTP/1.1
> Host: 10.10.xx.xx:8123
> User-Agent: curl/7.88.1
> Accept: */*
> Authorization: Bearer eyJhbGciOiJIUzI1NiIsInR5cCI
> Content-type: application/json
> Content-Length: 332
>
* Empty reply from server
* Closing connection 0
curl: (52) Empty reply from server
If I read this correctly, this seems to tell me that:
– the connection with the HA system is well established (so nothing preventing the connection to be setup in the first place)
– the token is proporly passed on
Noticed also this note:
Note: Unnecessary use of -X or –request, POST is already inferred.
Still slamming my head why I keep on seeing the “Empty reply from server” message over and over again…
Excellent articles! Keep up the great work!
Here’s a couple script improvement ideas:
Only run the ‘sensors’ command once and save/re-use its output for gathering each sensor’s values:
# sensors=`sensors` # or sensors=$(sensors)
# cpu_temp=$(echo $sensors | grep ……….
Switch from using grep/awk/sed text parsers to JSON, since the ‘sensors’ command can output JSON format too:
# sensors -j
# export sensors_JSON=`sensors -j` # need ‘export’ to expose this variable to child processes, i.e. Python below
# echo $sensors_JSON
Note: Customize below to your own JSON entities according to your own hardware and sensors command output from above:
# cpu_temp=`python3 -c “import os, json; print(json.loads(os.environ[‘sensors_JSON’])[‘coretemp-isa-0000’][‘Package id 0’][‘temp1_input’])”`
If you have the ‘jq’ command line JSON parser installed (apt install jq), then you can use this shorter command:
# sensors_JSON=`sensors -j` # export command not necessary here
# cpu_temp=`echo $sensors_JSON | jq ‘.”coretemp-isa-0000″.”Package id 0”.”temp1_input”‘`
cheers!
Macgyver24x7
@SHS – No further updates/advise re: my message of 02 Jan ?
If I read the curl verbose output correctly, this seems to tell me that:
– the connection with the HA system is well established (so nothing preventing the connection to be setup in the first place)
– the token is properly passed on
Still, not working…
Still seems like a network/firewall issue. If you are using PiHole’s IP as DNS, did you revert back to your DNS server in your router?
And not just disable PiHole?
Hy!
Works great for me. Thanks for the tuto!
On your first image, I can see that you are monitoring also other items (CPU usage, memory usage, …)
Can you show how you collected these items? And is it possible to have it per Container / VM?
Hi,
Use this: https://smarthomescene.com/guides/how-to-monitor-and-control-proxmox-virtual-environment-in-home-assistant/
Cheers